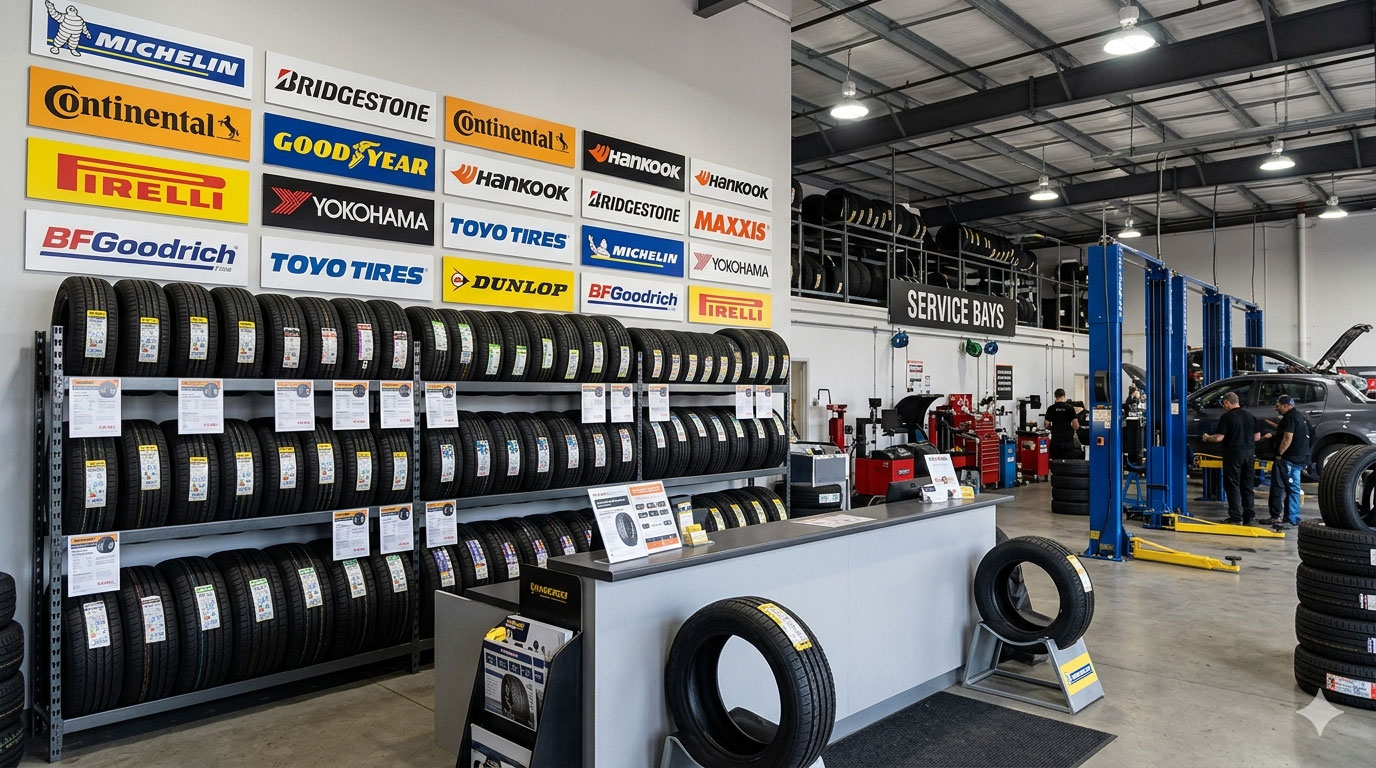
The 2026 rankings of the best tire brands are built on a new approach that solves a problem with traditional tire ratings: every tire is now judged only against others in its own category. The rankings reflect millions of owner-reported miles collected by TireGrades, with no sponsorships, no paid placements, and no editorial opinion—just aggregated owner satisfaction data filtered through evidence gates that ensure statistical confidence.
- Michelin — leads all brands with +1.18 category edge and 93% hit rate across nine categories.
- Vredestein — all eight qualifying tires above their category average, five of them everyday car tires.
- Cooper — perfect 100% hit rate with exceptional SUV and crossover tire strength at +1.15 edge.
- General — perfect 100% hit rate and a 70% head-to-head win rate across seven categories.
- Continental — wins 63% of head-to-head meetings, strongest in performance and SUV tires.
- Yokohama — +1.27 edge in SUV and crossover tires but struggles in truck segment at -0.80.
- Pirelli — +1.22 edge in SUV and crossover tires but below-average performance tire lineup at -0.10.
- Kumho — narrow +0.07 overall edge with mixed performance across everyday car tires at -0.23.
- Firestone — first below-average brand at -0.11 edge but exceptional performance tire at +1.35.
- Bridgestone — -0.50 edge with significant truck tire weakness at -2.30 across largest lineup tested.
This year, twelve brands cleared the minimum thresholds for ranking, and the results reveal which manufacturers consistently deliver tires that outperform their category peers. The method rewards brands for tire quality rather than for selling more winter and off-road tires, which owners rate more generously on average than everyday touring and highway tires.
How We Rank Tire Brands
The usual approach to rating tire brands—averaging a brand’s best-rated tires regardless of which category each one competes in—creates an unfair comparison. Our own earlier brand ranking worked that way. A brand with a deep line of winter and off-road tires benefits from the fact that owners in those categories rate their tires higher on average than owners of highway or touring tires do: the average passenger winter tire rates 8.43, the average grand touring all-season 6.83. That means a brand’s overall average reflects its product mix as much as its product quality, so comparing those averages across brands compares category portfolios as much as tires.
The 2026 rankings use category edge to solve this problem: every tire’s TireGrade (the confidence-weighted grade shown on its review page) is compared only with the average rating in its own category, and a brand’s category edge is the average of those differences across its qualifying tires. A category edge of +1.00 means the brand’s average tire scores a full point above the average tire in its own category. Two supporting metrics add context: hit rate reports the share of a brand’s qualifying tires that beat their category average, and the head-to-head record tallies wins, losses, and ties when two ranked brands meet in the same category. To qualify for ranking, a tire must have at least 2 million owner-reported miles, and a brand must field at least 8 such tires across at least 4 categories.
Twelve brands cleared the evidence gates this year. Goodyear ranked eleventh with a category edge of -0.54 and a 46% hit rate, while Hankook finished twelfth with a category edge of -0.54 and a 45% hit rate. Four additional brands fell short of the evidence thresholds—BFGoodrich and Falken each have 7 qualifying tires across 6 categories, one short of the bar, while Dunlop has 5 across 4 categories and Toyo 5 across 3. The absence of these brands from the rankings reflects insufficient data volume rather than a judgment about tire quality.
We also re-ran the ranking allowing for how widely ratings spread within each category. The top ten kept its order, except that Michelin and Vredestein traded first and second place — they are that close.
The 2026 Tire Brand Rankings
| Rank | Brand | Category Edge | Hit Rate | Head-to-Head | Qualifying Tires |
|---|---|---|---|---|---|
| #1 | Michelin | +1.18 | 93% | 51–16–1 | 27 of 44 |
| #2 | Vredestein | +1.11 | 100% | 27–8–1 | 8 of 11 |
| #3 | Cooper | +0.93 | 100% | 24–23–2 | 10 of 17 |
| #4 | General | +0.78 | 100% | 27–11–2 | 10 of 14 |
| #5 | Continental | +0.41 | 67% | 41–23–4 | 18 of 33 |
| #6 | Yokohama | +0.39 | 69% | 33–22–3 | 13 of 39 |
| #7 | Pirelli | +0.27 | 52% | 30–29–1 | 23 of 36 |
| #8 | Kumho | +0.07 | 60% | 20–36–4 | 15 of 23 |
| #9 | Firestone | −0.11 | 56% | 21–27–7 | 16 of 23 |
| #10 | Bridgestone | −0.50 | 45% | 27–44–2 | 31 of 67 |
Category edge: how far the brand’s average tire rates above (or below) the average tire in its own category. Hit rate: share of qualifying tires above their category average. Head-to-head: wins–losses–ties when the brand’s best tire meets another ranked brand’s best in a category both sell. Tires qualify with at least 2 million owner-reported miles. Also ranked: #11 Goodyear (−0.54), #12 Hankook (−0.54).
#1: Michelin
Michelin takes the top spot with a category edge of +1.18, the highest in the field, and a 93% hit rate that shows 25 of its 27 qualifying tires beating their category averages. The brand’s head-to-head record of 51-16-1 confirms its dominance in direct competition, and its strength is broad: its +1.68 edge across five truck tires and +1.27 across seven performance car tires are the strongest of any ranked brand with more than one qualifying tire in those segments, though its single qualifying winter tire managed only a +0.27 edge.
BEST DAILY-DRIVER CAR TIRE: MICHELIN DEFENDER2
The Michelin Defender2 earns an 8.2 TireGrade in the standard touring all-season category, where the average tire scores just 5.34—a difference of +2.86 that marks the widest edge of any Michelin qualifier. Owners reward it with a 9.4 treadwear rating, backed by 9 million miles of reported driving.
BEST PERFORMANCE CAR TIRE: MICHELIN PILOT SPORT 4S
The Michelin Pilot Sport 4S posts an 8.9 TireGrade against a 6.64 category average in max-performance summer tires, a +2.26 edge. Its 9.5 dry traction rating reflects the grip that made it a favorite among 18 million miles of enthusiast driving.
BEST SUV / CROSSOVER TIRE: MICHELIN CROSSCLIMATE SUV
The Michelin CrossClimate SUV scores a 7.3 TireGrade in the crossover and SUV touring category, where the 5.61 average leaves it with a +1.69 edge. Owners give it a 9.4 wet traction rating, backed by 3 million owner miles.
BEST TRUCK TIRE: MICHELIN DEFENDER LTX M/S
The Michelin Defender LTX M/S achieves an 8.8 TireGrade in the highway all-season category, +2.32 above the 6.48 average, and leads the brand’s truck tire lineup with 36 million owner miles. Its 9.2 treadwear rating demonstrates the durability that truck owners prioritize in daily-driver applications.
#2: Vredestein
Vredestein finishes second with a +1.11 category edge and a perfect 100% hit rate—all 8 of its qualifying tires beat their category averages. Its head-to-head record of 27-8-1 shows it wins three-quarters of its direct matchups, and its +1.41 edge across five everyday car tires is the strongest of any brand with more than two tires in that segment, though its narrower portfolio across just 4 categories limits its reach.
BEST DAILY-DRIVER CAR TIRE: VREDESTEIN HITRAC ALL SEASON
The Vredestein HiTrac All Season posts an 8.4 TireGrade against a 6.83 category average in grand touring all-season tires, a +1.57 edge supported by 14 million owner miles. Owners rate its dry traction at 9.2, and the tire’s balance across wet, comfort, and treadwear metrics makes it the strongest entry in Vredestein’s everyday lineup.
BEST PERFORMANCE CAR TIRE: VREDESTEIN HYPERTRAC ALL SEASON
The Vredestein Hypertrac All Season earns an 8.3 TireGrade in the ultra-high-performance all-season category, +1.03 above the 7.27 average, with 7 million owner miles behind it. Its 9.1 dry traction rating and 8.9 comfort score show it delivers grip without sacrificing ride quality.
BEST SUV / CROSSOVER TIRE: VREDESTEIN PINZA AT
The Vredestein Pinza AT scores an 8.4 TireGrade in the on-road all-terrain category, +0.63 above the 7.77 average, and represents Vredestein’s lone SUV qualifier with 6 million owner miles. Its 9.2 dry traction rating leads the tire’s attribute scores and underscores its pavement-focused design.
BEST TRUCK TIRE: No offering in this segment
Vredestein has no tire in the truck tire segment with enough owner miles to feature.
#3: Cooper
Cooper ranks third with a +0.93 category edge and a perfect 100% hit rate across 10 qualifying tires, though its 24-23-2 head-to-head record shows it wins only about half its direct battles. The brand’s +1.15 edge in SUV and crossover tires stands out as its strongest segment, and all five of its qualifying tires there rate above their category average.
BEST DAILY-DRIVER CAR TIRE: COOPER CS5 GRAND TOURING
The Cooper CS5 Grand Touring achieves a 6.7 TireGrade in the standard touring all-season category, +1.36 above the 5.34 average, with 2 million owner miles. Its 8.9 dry traction rating leads its attribute scores and reflects solid everyday performance in the most common passenger car category.
BEST PERFORMANCE CAR TIRE: COOPER ZEON RS3-G1
The Cooper Zeon RS3-G1 posts a 7.8 TireGrade against a 7.27 category average in ultra-high-performance all-season tires, a +0.53 edge earned across 4 million owner miles. Owners rate its dry traction at 9.1, the highest mark in the tire’s profile, and the Zeon represents Cooper’s sole performance car qualifier.
BEST SUV / CROSSOVER TIRE: COOPER ENDEAVOR PLUS
The Cooper Endeavor Plus scores a 7.9 TireGrade in the crossover and SUV touring category, +2.29 above the 5.61 average—the widest edge in Cooper’s entire lineup. With 8 million owner miles and a 9.2 dry traction rating, it leads a five-tire SUV lineup in which every tire rates above its category average.
BEST TRUCK TIRE: COOPER DISCOVERER S/T MAXX
The Cooper Discoverer S/T Maxx earns a 7.2 TireGrade in the commercial all-terrain category, +0.42 above the 6.78 average, with 2 million owner miles. Its 8.7 dry traction rating reflects capability on pavement, though the tire’s modest +0.42 edge shows it performs closer to the pack in this demanding segment.
#4: General
General lands at fourth with a +0.78 category edge, a perfect 100% hit rate across 10 qualifying tires, and a 27-11-2 head-to-head record that wins 70% of its direct matchups. Its two everyday car tires average a +1.42 edge, the highest in that segment, though on a smaller sample than Vredestein’s five, but it offers no qualifying SUV or crossover tire, a gap that narrows its appeal to car and truck buyers.
BEST DAILY-DRIVER CAR TIRE: GENERAL ALTIMAX RT45
The General AltiMAX RT45 posts an 8.5 TireGrade against a 6.83 category average in grand touring all-season tires, a +1.67 edge backed by 11 million owner miles. Owners rate its dry traction at 9.2, and the tire’s balanced 8.8 marks in comfort and treadwear make it a value standout in the everyday segment.
BEST PERFORMANCE CAR TIRE: GENERAL G-MAX RS
The General G-MAX RS achieves an 8.0 TireGrade in the ultra-high-performance summer category, +0.85 above the 7.15 average, with 3 million owner miles. Its 9.0 dry traction rating leads the attribute list and reflects the grip expected from a dedicated summer tire.
BEST SUV / CROSSOVER TIRE: No offering in this segment
General has no tire in the suv / crossover tire segment with enough owner miles to feature.
BEST TRUCK TIRE: GENERAL GRABBER HTS 60
The General Grabber HTS 60 scores an 8.0 TireGrade in the highway all-season category, +1.52 above the 6.48 average, with 7 million owner miles. Its 8.8 treadwear rating ties for the tire’s highest attribute score and demonstrates the longevity truck owners demand from highway-focused rubber.
#5: Continental
Continental finishes fifth with a +0.41 category edge and a 67% hit rate that shows 12 of its 18 qualifying tires beating their category averages. Its 41-23-4 head-to-head record wins 63% of direct matchups, and the brand’s breadth across 9 categories spans nine categories, though its everyday car tire edge sits at exactly 0.00 and its performance tire segment carries the portfolio with a +0.65 edge.
BEST DAILY-DRIVER CAR TIRE: CONTINENTAL TRUECONTACT TOUR 54
The Continental TrueContact Tour 54 posts a 7.1 TireGrade against a 5.34 category average in standard touring all-season tires, a +1.76 edge earned across 2 million owner miles. Owners rate its dry traction at 9.3 and its treadwear at 9.2.
BEST PERFORMANCE CAR TIRE: CONTINENTAL EXTREMECONTACT DWS 06 PLUS
The Continental ExtremeContact DWS 06 Plus achieves an 8.8 TireGrade in the ultra-high-performance all-season category, +1.53 above the 7.27 average, with 59 million owner miles, tied with the Goodyear Integrity for the largest data set of any qualifying tire. Owners rate its dry traction at 9.3 and its wet traction at 9.1.
BEST SUV / CROSSOVER TIRE: CONTINENTAL CROSSCONTACT LX25
The Continental CrossContact LX25 scores an 8.6 TireGrade in the crossover and SUV touring category, +2.99 above the 5.61 average—the widest edge in the entire Continental lineup. With 24 million owner miles and a 9.3 dry traction rating, it represents the brand’s strongest single offering.
BEST TRUCK TIRE: CONTINENTAL TERRAINCONTACT H/T
The Continental TerrainContact H/T earns an 8.2 TireGrade in the highway all-season category, +1.72 above the 6.48 average, with 6 million owner miles. Owners rate its dry traction at 9.1 and its treadwear at 9.0.
#6: Yokohama
Yokohama ranks sixth with a +0.39 category edge and a 69% hit rate across 13 qualifying tires, plus a 33-22-3 head-to-head record that wins 59% of its matchups. The brand’s +1.27 edge in SUV and crossover tires stands as its strongest segment, but its truck tire portfolio posts a -0.80 edge that drags down the overall average and limits its appeal to pickup owners.
BEST DAILY-DRIVER CAR TIRE: YOKOHAMA AVID ASCEND LX
The Yokohama AVID Ascend LX posts a 7.7 TireGrade against a 5.34 category average in standard touring all-season tires, a +2.36 edge supported by 7 million owner miles. Owners rate its dry traction at 9.2, the tire’s highest attribute score, and the Ascend LX represents Yokohama’s strongest everyday car offering.
BEST PERFORMANCE CAR TIRE: YOKOHAMA ADVAN SPORT A/S+
The Yokohama ADVAN Sport A/S+ achieves a 7.9 TireGrade in the ultra-high-performance all-season category, +0.63 above the 7.27 average, with 3 million owner miles. Its 9.2 dry traction rating leads the tire’s profile and reflects the grip that defines the ADVAN nameplate.
BEST SUV / CROSSOVER TIRE: YOKOHAMA GEOLANDAR CV G058
The Yokohama Geolandar CV G058 scores a 7.4 TireGrade in the crossover and SUV touring category, +1.79 above the 5.61 average, with 3 million owner miles. Owners give it a 9.3 dry traction rating, the tire’s standout attribute, and the CV G058 anchors Yokohama’s strongest segment edge.
BEST TRUCK TIRE: YOKOHAMA GEOLANDAR H/T G056
The Yokohama Geolandar H/T G056 earns a 7.5 TireGrade in the highway all-season category, +1.02 above the 6.48 average, with 3 million owner miles. Its 9.0 treadwear rating leads the tire’s attributes, though Yokohama’s four qualifying truck tires average −0.80 as a group.
#7: Pirelli
Pirelli finishes seventh with a +0.27 category edge and a 52% hit rate that shows just 12 of 23 qualifying tires beating their category averages. Its 30-29-1 head-to-head record wins only 51% of direct matchups, and while the brand’s +1.22 edge in SUV and crossover tires demonstrates strength in that segment, its performance car tire portfolio posts a -0.10 edge that reveals weakness in the category most associated with the Pirelli name.
BEST DAILY-DRIVER CAR TIRE: PIRELLI P7 AS PLUS 3
The Pirelli P7 AS Plus 3 posts an 8.3 TireGrade against a 6.83 category average in grand touring all-season tires, a +1.47 edge backed by 9 million owner miles. Owners rate its dry traction at 9.3, and the P7 leads Pirelli’s everyday car tire lineup with balanced performance across all attributes.
BEST PERFORMANCE CAR TIRE: PIRELLI P ZERO AS PLUS 3
The Pirelli P Zero AS Plus 3 achieves an 8.3 TireGrade in the ultra-high-performance all-season category, +1.03 above the 7.27 average, with 5 million owner miles. Its 9.3 dry traction rating is its highest mark, and the tire sits well above Pirelli’s performance lineup as a whole, which averages −0.10.
BEST SUV / CROSSOVER TIRE: PIRELLI SCORPION AS PLUS 3
The Pirelli Scorpion AS Plus 3 scores an 8.5 TireGrade in the crossover and SUV touring category, +2.89 above the 5.61 average, with 27 million owner miles. Owners give it a 9.4 dry traction rating, and the Scorpion represents Pirelli’s single strongest tire by both edge and data volume.
BEST TRUCK TIRE: PIRELLI SCORPION ALL TERRAIN PLUS
The Pirelli Scorpion All Terrain Plus earns an 8.1 TireGrade in the off-road all-terrain category, -0.16 below the 8.26 average, with 8 million owner miles. It is the stronger of Pirelli’s two qualifying truck tires by edge, and still sits just below its category average; owners rate its dry traction at 9.1.
#8: Kumho
Kumho ranks eighth with a narrow +0.07 category edge and a 60% hit rate across 15 qualifying tires, plus a 20-36-4 head-to-head record that wins only 37% of direct matchups. The brand’s -0.23 edge in everyday car tires pulls down its overall average, though a +1.52 edge from its single qualifying truck tire shows capability in select segments.
BEST DAILY-DRIVER CAR TIRE: KUMHO SOLUS TA11
The Kumho Solus TA11 posts a 6.8 TireGrade against a 5.34 category average in standard touring all-season tires, a +1.46 edge earned across 2 million owner miles. Owners rate its dry traction at 8.8, and the tire delivers above-average performance despite Kumho’s struggles in the everyday car segment overall.
BEST PERFORMANCE CAR TIRE: KUMHO ECSTA PA51
The Kumho Ecsta PA51 achieves a 7.6 TireGrade in the ultra-high-performance all-season category, +0.33 above the 7.27 average, with 3 million owner miles. Its 8.9 dry traction rating leads the tire’s attribute scores, and the Ecsta represents Kumho’s sole performance car qualifier.
BEST SUV / CROSSOVER TIRE: KUMHO CRUGEN HP71
The Kumho Crugen HP71 scores a 7.0 TireGrade in the crossover and SUV touring category, +1.39 above the 5.61 average, with 5 million owner miles. Owners rate its dry traction at 8.9, the tire’s highest attribute mark, and it stands as the strongest edge among Kumho’s 5 SUV qualifiers.
BEST TRUCK TIRE: KUMHO CRUGEN HT51
The Kumho Crugen HT51 earns an 8.0 TireGrade in the highway all-season category, +1.52 above the 6.48 average, with 12 million owner miles. Its 8.7 treadwear rating reflects solid durability, and its +1.52 edge is the largest of any Kumho qualifier.
#9: Firestone
Firestone finishes ninth with a -0.11 category edge, the first below-average brand in the rankings, though its 56% hit rate shows 9 of 16 qualifying tires still beat their category averages. Its 21-27-7 head-to-head record wins only 45% of direct matchups, and while a +1.35 edge in performance car tires demonstrates capability in one segment, its -0.63 edge in everyday car tires and -0.16 edge in truck tires drag down the portfolio.
BEST DAILY-DRIVER CAR TIRE: FIRESTONE WEATHERGRIP
The Firestone WeatherGrip posts a 7.7 TireGrade against a 6.83 category average in grand touring all-season tires, a +0.87 edge backed by 5 million owner miles. Owners rate its dry traction at 9.0 and its wet traction at 8.9, and the WeatherGrip represents Firestone’s strongest everyday car qualifier.
BEST PERFORMANCE CAR TIRE: FIRESTONE FIREHAWK INDY 500
The Firestone Firehawk Indy 500 achieves an 8.5 TireGrade in the ultra-high-performance summer category, +1.35 above the 7.15 average, with 11 million owner miles. Owners rate its dry traction at 9.3.
BEST SUV / CROSSOVER TIRE: FIRESTONE DESTINATION A/T
The Firestone Destination A/T scores an 8.3 TireGrade in the on-road all-terrain category, +0.53 above the 7.77 average, with 41 million owner miles—the largest data set of any Firestone qualifier. Its 8.9 dry traction rating anchors the tire’s balanced attribute profile and broad real-world testing base.
BEST TRUCK TIRE: FIRESTONE DESTINATION LE3
The Firestone Destination LE3 earns an 8.2 TireGrade in the highway all-season category, +1.72 above the 6.48 average, with 11 million owner miles. Owners reward its treadwear with a 9.0 rating, the tire’s highest attribute score, though it remains an outlier in a truck tire segment where Firestone’s portfolio underperforms overall.
#10: Bridgestone
Bridgestone rounds out the top ten at tenth with a -0.50 category edge and a 45% hit rate that shows just 14 of 31 qualifying tires beating their category averages. Its 27-44-2 head-to-head record wins only 38% of direct matchups, and the portfolio’s -2.30 edge in truck tires represents the worst segment performance in the entire field despite offering the largest lineup at 31 qualifiers across 11 categories.
BEST DAILY-DRIVER CAR TIRE: BRIDGESTONE DRIVEGUARD PLUS
The Bridgestone DriveGuard Plus posts a 7.8 TireGrade against a 6.83 category average in grand touring all-season tires, a +0.97 edge earned across 3 million owner miles. Owners rate its dry traction at 9.3, the tire’s highest attribute score, and the DriveGuard Plus stands as Bridgestone’s strongest everyday car qualifier.
BEST PERFORMANCE CAR TIRE: BRIDGESTONE POTENZA RE980AS+
The Bridgestone Potenza RE980AS+ achieves an 8.2 TireGrade in the ultra-high-performance all-season category, +0.93 above the 7.27 average, with 6 million owner miles. Its 9.2 dry traction rating leads the tire’s profile and reflects solid capability in a performance segment where Bridgestone posts a modest +0.25 overall edge.
BEST SUV / CROSSOVER TIRE: BRIDGESTONE DUELER H/L ALENZA
The Bridgestone Dueler H/L Alenza scores a 7.4 TireGrade in the crossover and SUV touring category, +1.79 above the 5.61 average, with 32 million owner miles. Owners rate its dry traction at 8.7, and the Alenza represents Bridgestone’s strongest SUV offering by both edge and data volume in a segment where the brand manages only a +0.10 overall edge.
BEST TRUCK TIRE: BRIDGESTONE DUELER H/L 400 RFT
The Bridgestone Dueler H/L 400 RFT earns a 5.6 TireGrade in the highway all-season category, -0.88 below the 6.48 average, with 3 million owner miles. Its 7.3 dry traction rating leads the tire’s modest attribute scores, and the below-average performance reflects the broader struggle across Bridgestone’s truck tire portfolio.
Final Thoughts
Michelin takes the 2026 crown with a +1.18 category edge that leads the field and a 93% hit rate that shows nearly every tire in its lineup beating the category average. Its lead over Vredestein is only 0.07, but Michelin earns it across 27 qualifying tires in nine categories against Vredestein’s eight in four, and its 51-16-1 head-to-head record means its best tire wins about three of every four meetings with a rival brand’s best.
Value-focused brands outperformed several household names in this year’s rankings. Vredestein, Cooper, and General all posted perfect 100% hit rates and finished ahead of Continental, Yokohama, and Pirelli, while Goodyear and Hankook landed outside the top ten entirely. Once tires are compared within their own categories, a familiar name is not a reliable guide to owner satisfaction, and buyers willing to look past the best-known logos will find tires that owners rate as highly or higher.
Every tire featured in these rankings has a detailed review page at TireGrades.com with the full breakdown of owner ratings, mileage data, and category context. The individual tire reviews provide the granular information needed to match a specific tire to your vehicle, driving style, and climate—because even the best brand sells tires built for different jobs, and the right choice depends on which job is yours.
Good luck and happy motoring.